A home sensor with Arduino, InfluxDB and Grafana
Page content
TL;DR: it was fun to build great graphs. But the battery did not last long, air quality is difficult to track.
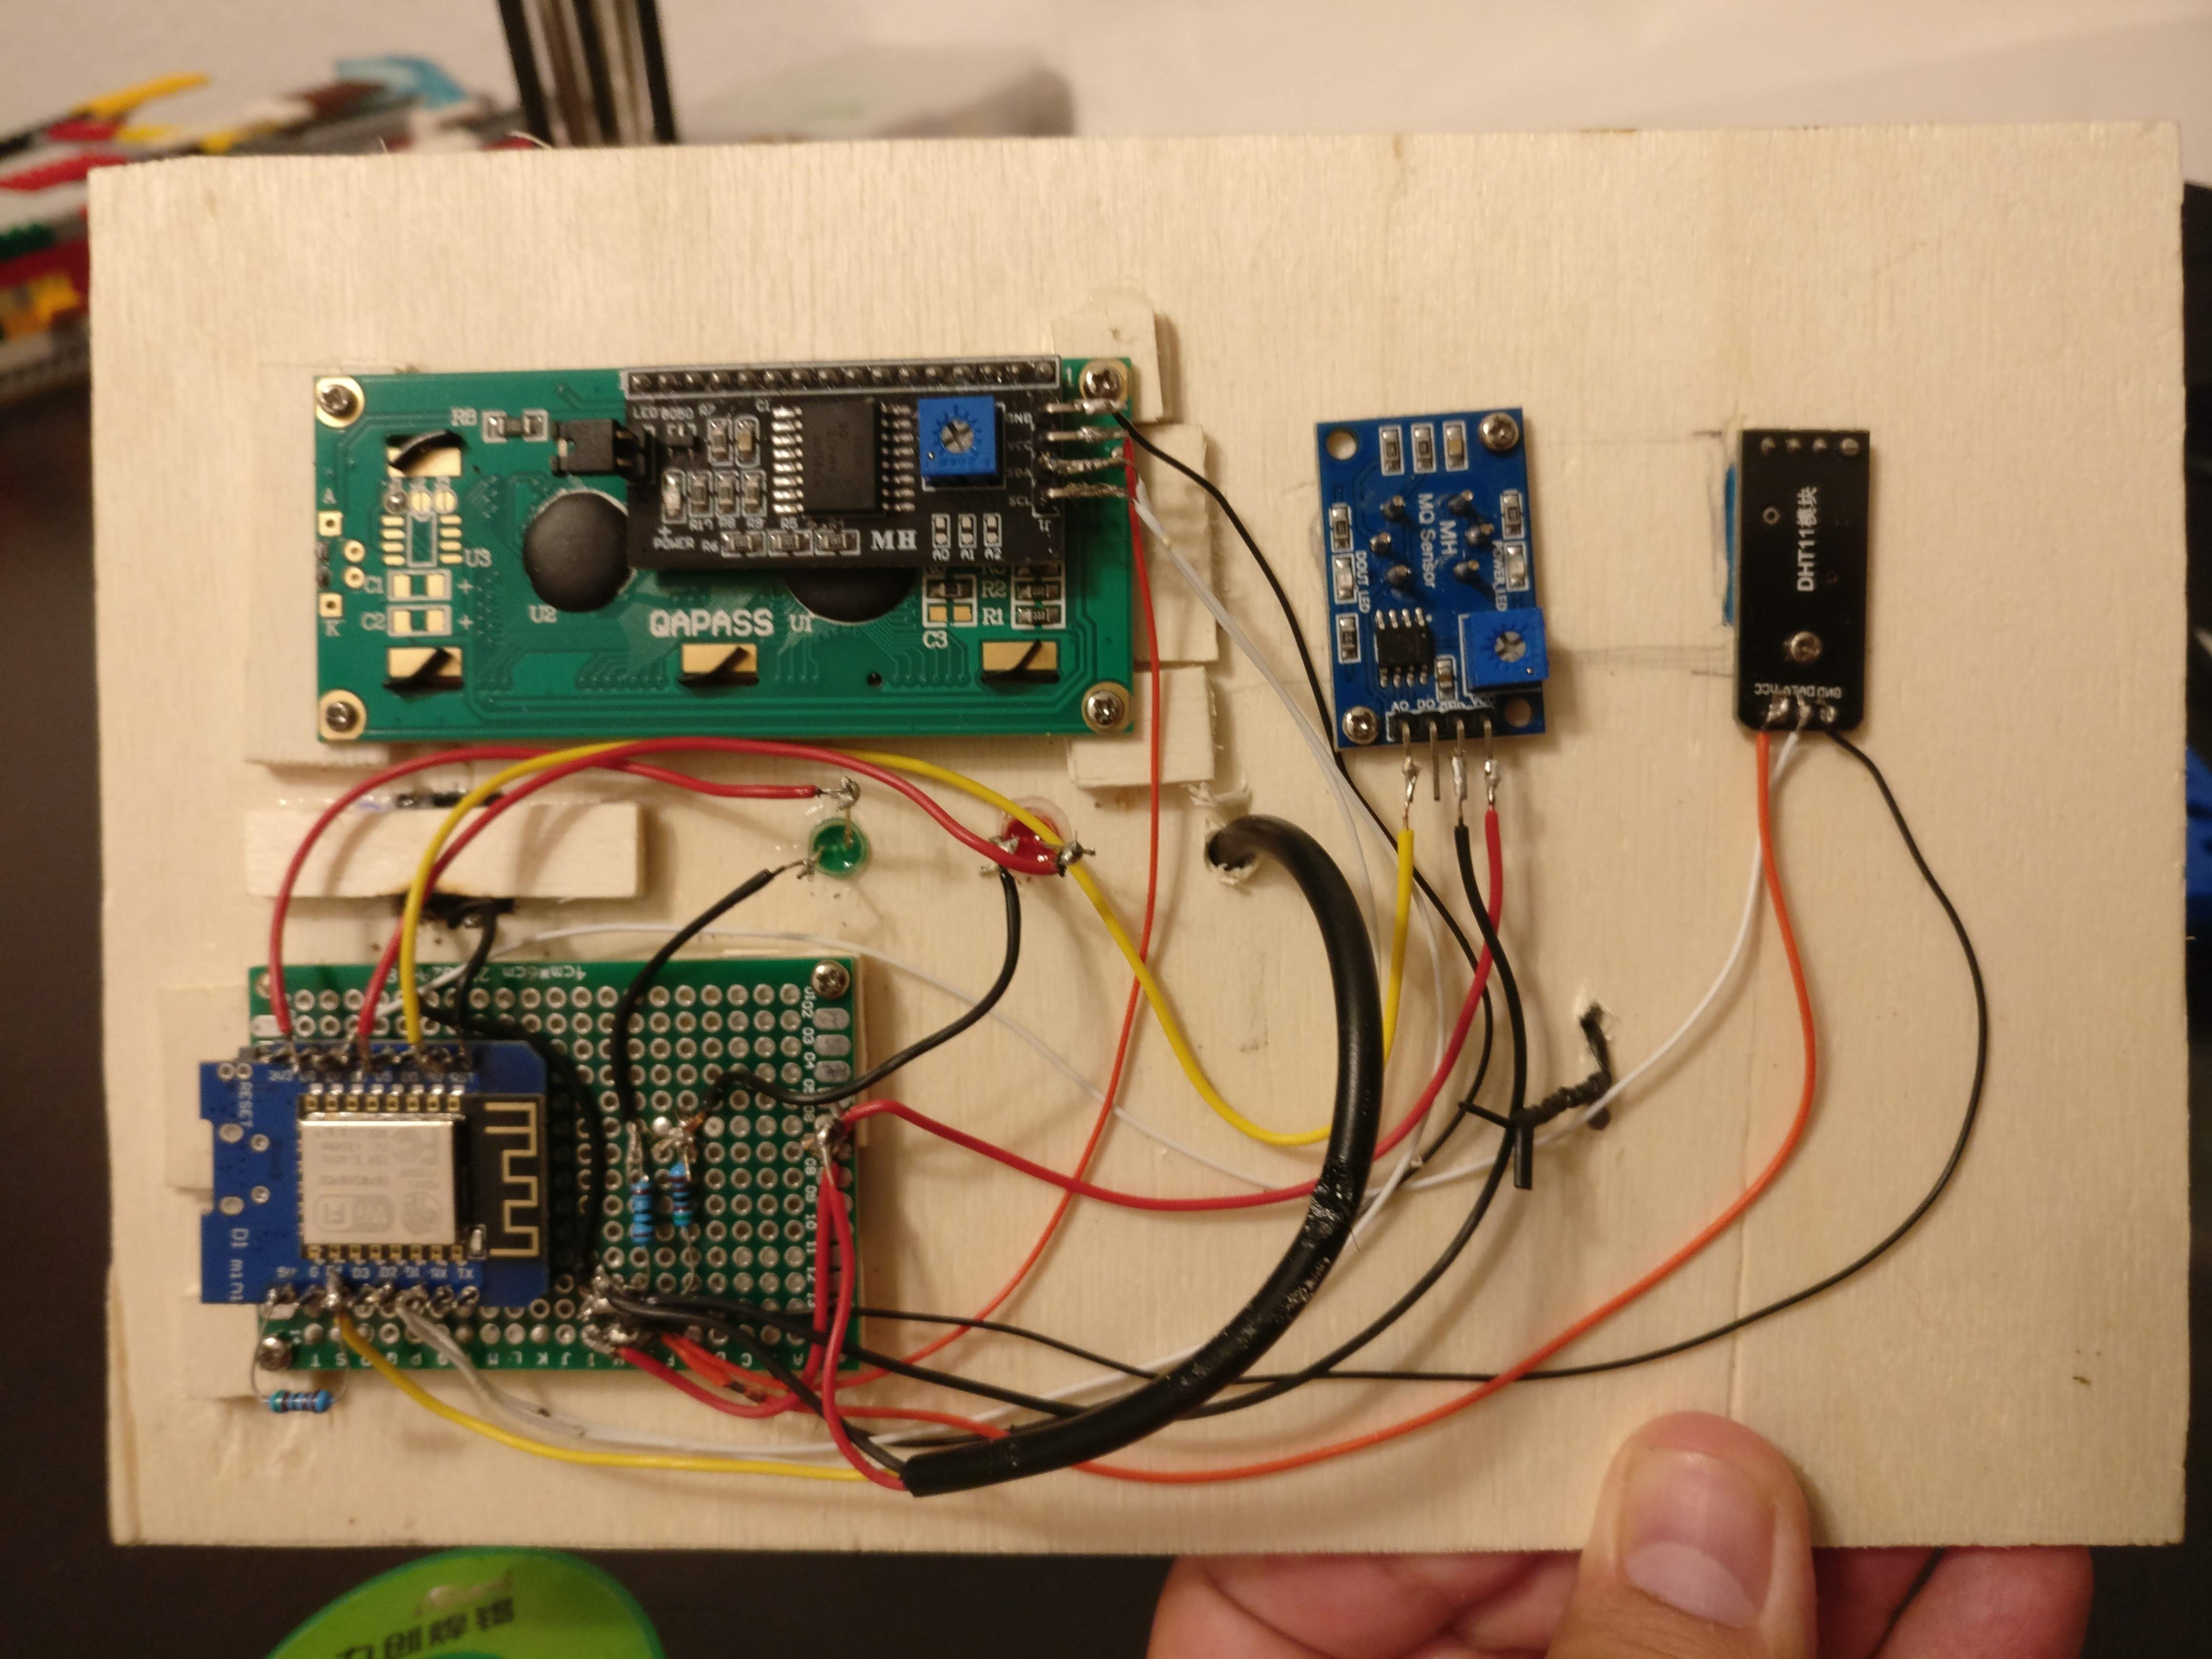
Above, the box with plywood. Because I do not have a 3d printer, and I like wood.
Ingredients
For the sensor box
- ESP 8826, WEMOS D1
- LCD 20x16
- Humidity sensor DHT11
- Air quality sensor MQ9
- Red and Green LEDs, corresponding resistors
For the outside sensor
- Old pickes glass jar, and glue or silicon to seal it.
- ESP 8826, WEMOS D1
- 11B12 Temperature sensor
- Batteries AA, rechargeable (because environment)
the server side
- Nginx, with full encryption and authentication for the
- InfluxDB, for storing the datapoints
- Grafana
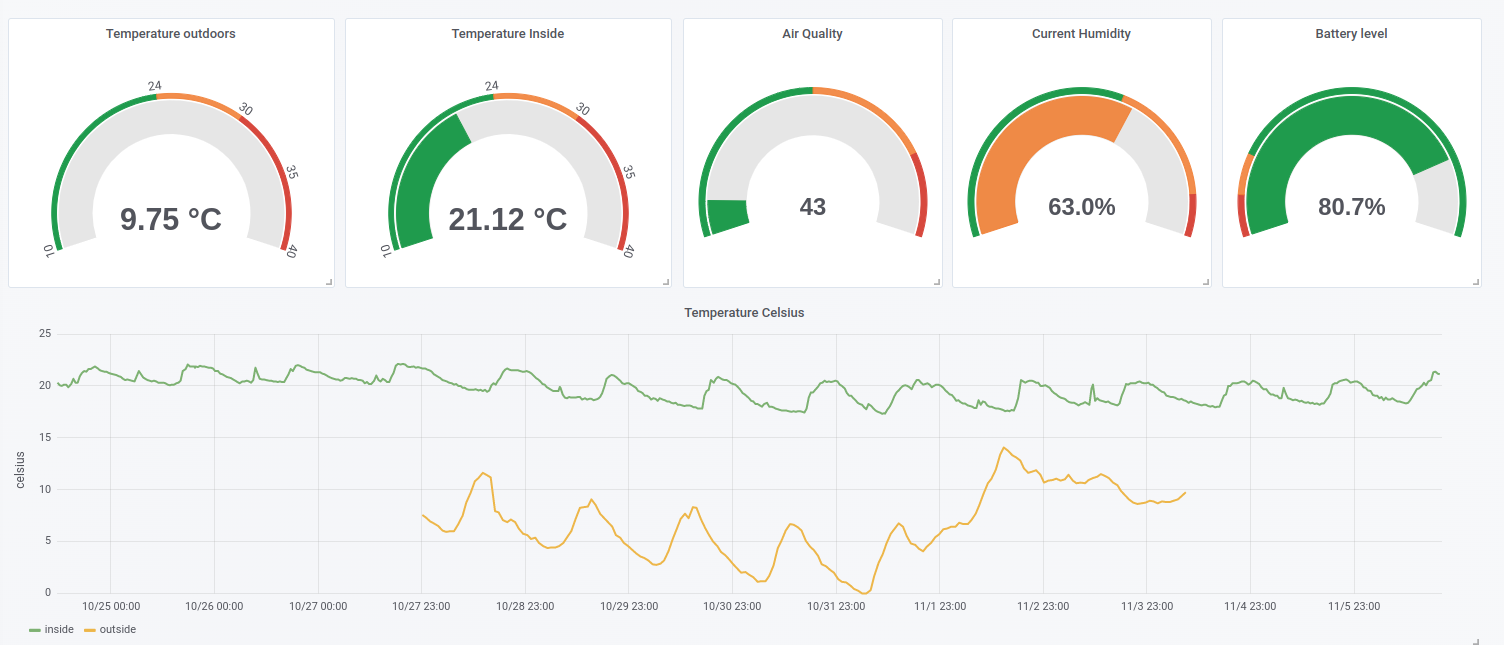
the result
Nice graphs were plotted, at year end was not too cold in Berlin:
Lessons learned
-
If you cannot know why is not working, its hardware. This is from the PoV of a Software Developer tottally newbie in electronics.
-
Battery life is hard. Stuff we take for granted like doing TLS encryption, in embedded development becomes a critical point for power consumption.
-
Air quality measurement with MQ sensor was disappointing. Maybe have to spend a bit more, or just learn how to calibrate it.